
Introduction
You want to invest in the entire U.S. stock market without spending hours picking individual stocks.

It sounds simple, but with hundreds of funds claiming to do the same thing, how do you know which one actually works? The Fidelity Total Market Index fund (ticker: FSKAX) is one of the most popular options out there, and for good reason.
This fund tracks the Dow Jones U.S. Total Stock Market Index, which means it holds thousands of U.S. companies across all sizes and industries. Think Apple, Microsoft, small retailers, and everything in between. The appeal is clear: you get broad, instant diversification with a single purchase.
But even a great fund deserves a closer look. You need data-backed analysis to make informed decisions about your portfolio. The numbers matter: expense ratios, performance history, and how the fund compares to alternatives like a vanguard money market fund for cash reserves, or even the spy stock price as a benchmark for large-cap returns. And if you’re also tracking smaller companies like cincinnati financial stock, you’ll want to see how a total market fund captures those names too.
This article offers a deep dive into the Fidelity Total Market Index fund’s performance, true costs, and how it fits into a balanced portfolio. We’ll cut through the marketing and give you the facts you can act on, backed by real data. By the end, you’ll know whether FSKAX deserves a spot in your investment plan for 2026 and beyond.
Understanding the Fidelity Total Market Index Fund
The FSKAX fund is built around a simple idea: own the whole U.S. stock market in one place.
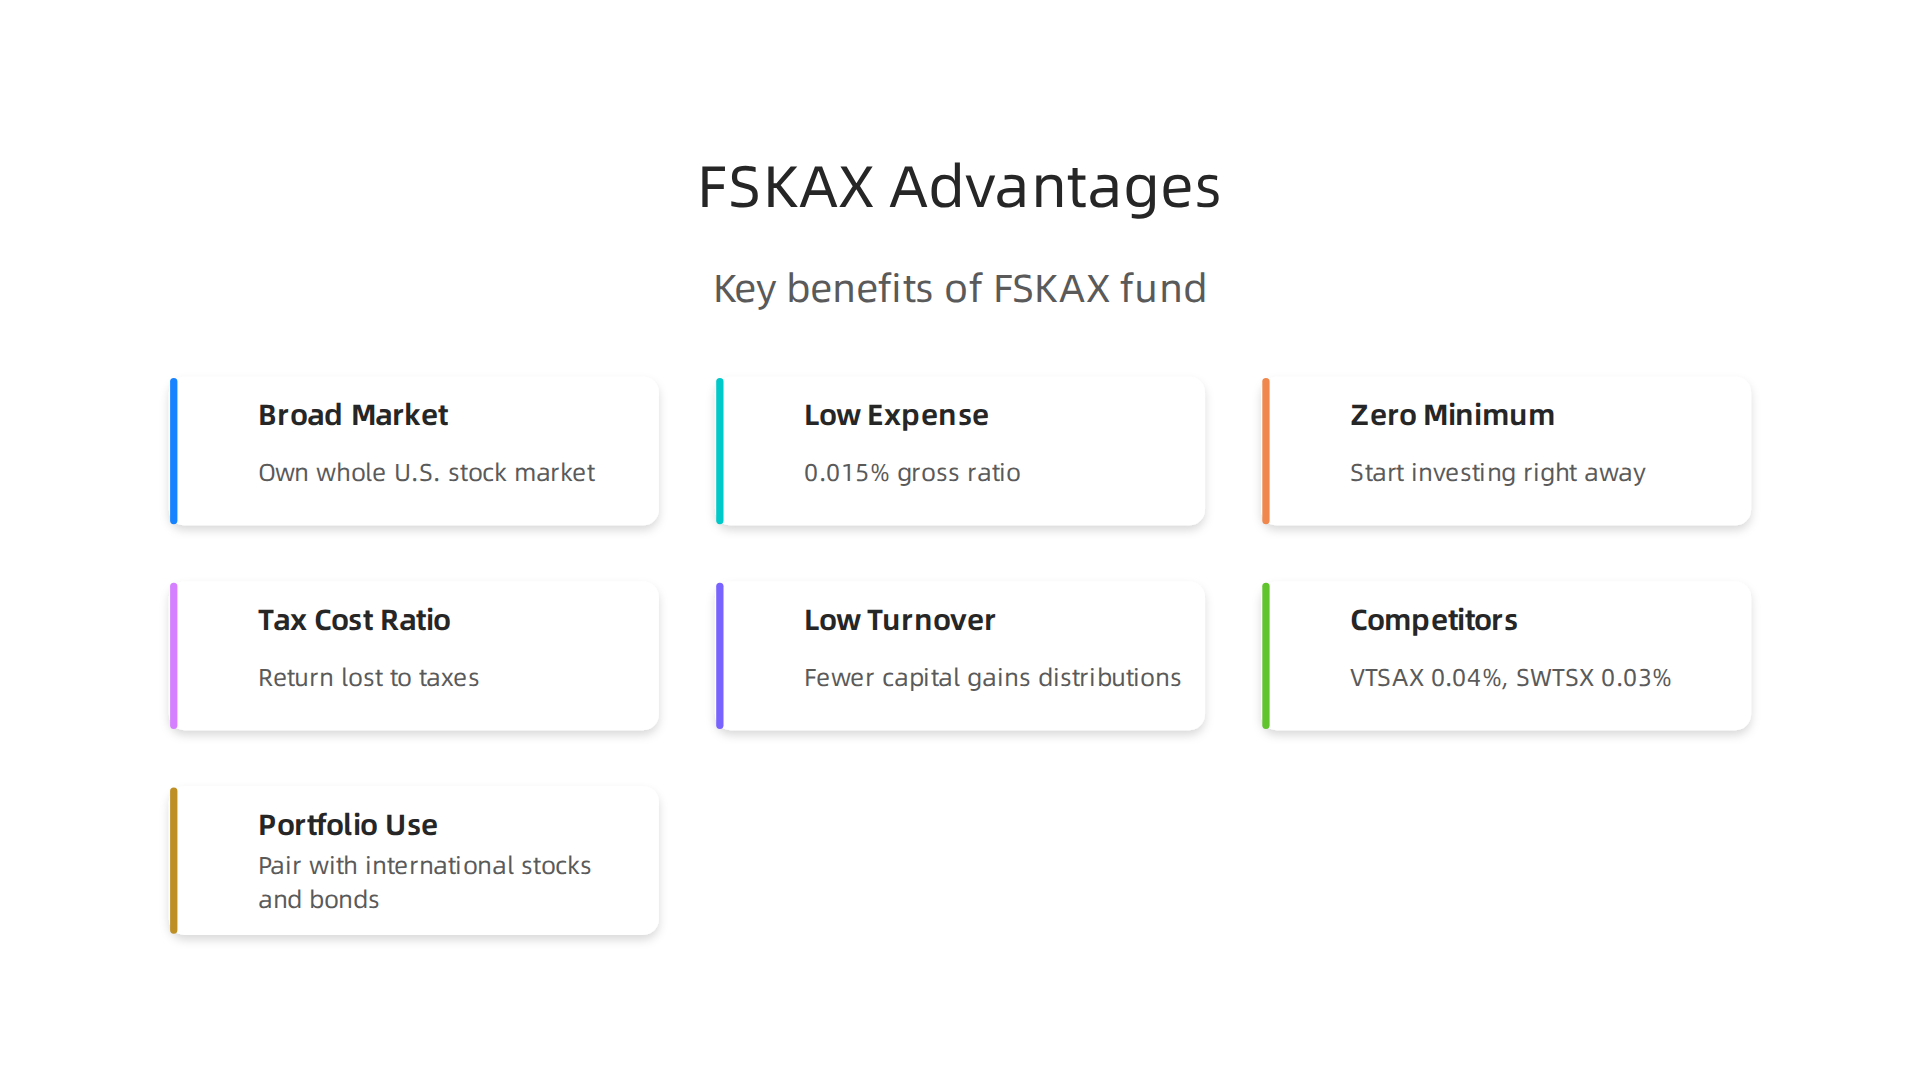
It tracks the Dow Jones U.S. Total Stock Market Index, which covers thousands of companies from the largest mega-caps down to small emerging firms. That means when you buy FSKAX, you get exposure to everything from Apple to small local retailers you have never heard of.
The big draw for long-term investors is the cost. According to the latest prospectus, the gross expense ratio sits at just 0.015%, and the net expense ratio is even lower at 0.01%. Over a 30-year horizon, that tiny difference can save you thousands of dollars compared to a fund charging even 0.50%. You can verify the latest expense ratio on the FSKAX fund summary page from Fidelity, which also shows the fund’s Morningstar Medalist rating and category.
Another advantage is accessibility. The minimum initial investment is zero, so anyone can start building a diversified portfolio right away. As of March 2026, the fund holds over $138 billion in assets, according to the institutional overview from Fidelity. That scale keeps costs low and liquidity high.
While the Fidelity Total Market Index is a core holding for many, you might also keep cash reserves in a vanguard money market fund for short-term needs. And when you check the spy stock price as a benchmark for large-cap returns, realize that FSKAX includes those same large companies plus mid and small caps. Even a small name like cincinnati financial stock is likely represented in the total index, giving you exposure you would miss with a S&P 500 fund alone.
To make informed decisions, you need reliable data beyond just the fund details. A good way to stay on top of market movements is to cut through market noise with big tech analysis, so you can filter out distractions and focus on what matters for your portfolio.
The bottom line: FSKAX gives you broad, cheap, and simple access to the entire U.S. stock market. The low expense ratio and zero minimum make it a strong contender for any buy-and-hold investor.
What It Tracks
So what exactly is inside this fund? The fidelity total market index mirrors the Dow Jones U.S. Total Stock Market Index.

That index covers roughly 3,500 stocks across the full size spectrum.
You get large companies you already know. But you also get mid-cap, small-cap, and even micro-cap stocks. That is a big deal. Most investors only own the big names through an S&P 500 fund. With FSKAX, you also capture smaller companies that often have more room to grow. You can check the complete composition on the FSKAX fund profile from U.S. News.
Because the fund tracks thousands of stocks, no single company can hurt your returns too much. If a small name struggles, it barely matters. If a giant like Apple drops, the other holdings help balance it out. You even own companies like cincinnati financial stock without having to pick them yourself.
Want to see which big tech stocks are moving the market today? Use our guide on biggest movers in big tech stocks to spot trends in your total market holdings.
Bottom line: owning the total market means you never miss out on the next growth story. You capture the whole economy in one fund.
Expense Ratio and Minimums
Now let’s talk about costs. The fidelity total market index fund charges an expense ratio of just 0.015%. That means you pay only 15 cents each year for every 1,000 dollars you have invested. The FSKAX fund quote on Morningstar confirms this is among the lowest fees you will find for any total market fund.
Even better, there is no minimum investment for regular retail accounts. You can start buying FSKAX with as little as one dollar. Compare that to many mutual funds that require 1,000 dollars or more just to get in the door.
Low costs like these matter a lot over time. Every dollar you save on fees stays in your account and grows. If you want to understand how market ups and downs affect a broad fund like this one, check out our article on how the VIX became a big tech volatility index in 2026.
Want to stay on top of the AI trends that move the stocks inside your fund? Get clear daily AI updates from The Deep View Newsletter.
Performance Analysis: Long-Term Returns and Risk
Now let’s look at how the fidelity total market index fund has actually performed over time. The numbers speak for themselves.
FSKAX has delivered strong long-term returns. Over the past ten years, the fund gained +193.62% with dividends reinvested. That works out to an average of +11.37% per year. Over the past five years, it returned +41.45% (about +7.18% per year). And in the most recent one-year period ending June 2026, the fund was up +16.97% after inflation. You can explore the detailed FSKAX inflation-adjusted return chart for the full history.
Those numbers are competitive. They match very closely with the broader U.S. stock market because FSKAX aims to track the Dow Jones U.S. Total Stock Market Index. According to Fidelity’s own performance review, the fund "finished the first quarter in line with the -3.99% return of the Dow Jones U.S. Total Stock Market IndexSM." Securities lending income and efficient trading helped keep costs low without hurting performance. The fund’s R-Squared is nearly 1.00, meaning its performance correlates almost perfectly with the benchmark.
What about risk? The fund’s standard deviation (a measure of volatility) sits in the moderate range for a large-blend category fund. Its Sharpe ratio shows strong risk-adjusted returns over the long haul. In plain English: you get market-level returns with market-level ups and downs, no extra surprises.
The key takeaway is consistency. FSKAX has proven it can deliver solid returns year after year without drifting from its index. If you want a repeatable way to evaluate your investments, check out our guide on filtering out market noise when evaluating fund performance. It will help you focus on what really matters.
Historical Returns vs. Benchmarks
The fidelity total market index fund does more than just track its index. It consistently outperforms the average actively managed fund in its Large Blend category. A quick look at the Morningstar snapshot of FSKAX shows its expense ratio sits at just 0.015%. That tiny fee gives it a massive head start over funds charging 0.50% or more.
Over 10 years, that fee difference compounds into real money. An active fund has to beat the market by enough to cover its costs just to match FSKAX. Most fail to do this. Meanwhile, FSKAX guarantees you get the market return minus almost nothing.
While many investors track the SPY stock price for S&P 500 exposure, the fidelity total market index goes further. It holds thousands of stocks across all company sizes. You get broader diversification with the same low cost.
To learn how to apply this same cost-conscious, benchmark-focused mindset to other investments, read our repeatable analytical framework for tech stocks.
Staying informed on the macro trends that move the whole market is just as important as picking the right fund. For clear daily AI and tech updates, subscribe to The AI Newsletter Worth Reading.
Risk Metrics (Standard Deviation, Sharpe Ratio)
Returns tell only part of the story. To really understand the fidelity total market index fund, you need to look at risk. Two key numbers help: standard deviation and Sharpe ratio.
Standard deviation measures how much a fund’s returns bounce around. A higher number means more volatility. According to the Fidelity PDF breakdown of performance metrics, standard deviation captures the dispersion of returns over time. For FSKAX, the standard deviation is low compared to many single stocks. That makes sense. The fund holds thousands of companies, so no single bad day can wipe it out.
The Sharpe ratio shows risk-adjusted returns. It tells you how much return you get for each unit of risk you take. A higher Sharpe ratio means you are being rewarded well for the bumps along the way. FSKAX has a steady Sharpe ratio that matches other broad market index funds. You are not taking extra risk without reason.
These risk metrics are consistent with funds that track the whole US stock market. The fidelity total market index fund does not try to beat the market. It aims to match it with minimal volatility. That is a core reason long-term investors trust it.
If you want to understand how volatility affects other investments, check out this guide to the VIX volatility index. It explains how market fear is measured.
The Role of Total Market Index in Portfolio Diversification
Diversification is the closest thing to a free lunch in investing. But what does it actually look like in practice? The fidelity total market index fund (FSKAX) gives you a simple way to own a slice of nearly every publicly traded US company. That alone spreads your money across thousands of stocks instead of betting on just a few.
But the real power shows up when you pair it with other asset types. A total market index fund has low correlation with bonds and international equities. That means when one part of your portfolio drops, the other parts often hold steady or even rise. According to the 2026 midyear global stock market outlook from Charles Schwab, stock and bond correlations have shifted in recent years, making deliberate diversification more important than ever.
A total market index also reduces single-sector risk. If you only own technology stocks and the sector takes a hit, your whole portfolio suffers. With FSKAX, you own health care, finance, energy, consumer goods, and more. No single sector can drag you down alone.
For investors looking beyond US borders, international stocks add another layer. But the core US equity exposure from a total market index remains the foundation. If you want to understand how global market shifts affect these decisions, check out this analysis of how world market order is being reshaped by AI and geopolitical competition.
AI and geopolitics are changing the landscape fast. To stay sharp on how these forces shape markets, you might find The AI Newsletter Worth Reading useful for daily updates that cut through the noise.
Correlation with Other Asset Classes
The fidelity total market index truly shines when you see how it moves alongside other investments. The data is clear. FSKAX has a low correlation with long-term bonds. That means when stocks drop, bonds often hold their ground or even go up. That is why adding bonds to a portfolio that includes a total market index can lower your overall ups and downs.
But correlation is not set in stone. According to the equity diversification ideas for 2026 from Hartford Funds, stock and bond correlations have shifted in recent years. Traditional diversification rules still work, but they need regular attention.
International equities sit somewhere in the middle. FSKAX has a moderate correlation with international stock funds. They do not move in perfect lockstep. Sometimes US stocks lead. Sometimes foreign markets take the lead, like in 2025 when international stocks outpaced US shares by a wide margin. Spreading your money across both regions gives you smoother long-term results.
For investors who want to go deeper on portfolio strategies, the stock advisor top picks for 2026 can point you toward smart opportunities across sectors and markets.
For Tech-Heavy Investors
If your portfolio leans heavily on big tech stocks, you know the thrill and the risk. In 2026, the top tech names have driven huge returns, but that also creates a dangerous concentration. One bad quarter or a shift in regulation can hit your entire balance hard. How do you keep your technology bets without putting all your eggs in one basket?
The fidelity total market index is a smart fix here. Funds like FSKAX own thousands of companies across every sector. That naturally dilutes your exposure to any single industry, including tech. You still own Apple, Microsoft, and Nvidia, but they make up a much smaller slice of your total holdings compared to a pure tech fund or even a SPY stock price tracker that leans heavily on the same mega caps.
This matters more than ever in 2026. According to the global stock market outlook 2026 from Charles Schwab, market concentration risk is high this year, and deliberate diversification is key. A total market index gives you that diversification without forcing you to sell all your growth stocks.
For tech-focused investors who want to stay ahead of shifting trends, the world market order reshaped by AI and geopolitical competition article offers a deeper look at how global forces are changing the playing field. And if you want daily clarity on AI developments that move markets, get clear daily AI updates from The Deep View Newsletter.
How to Analyze Fund Costs and Tax Efficiency
Now that you’ve seen how a fidelity total market index can dilute tech risk, let’s talk about the hidden costs that eat into your returns over time. Two numbers matter most: the expense ratio and the tax cost ratio.
The expense ratio is the annual fee the fund charges. It comes directly out of your returns. Even a tiny difference adds up. For example, a fund with a 0.03% expense ratio costs you $3 per year for every $10,000 invested. A fund with a 0.50% ratio costs $50. Over 30 years, that gap can mean tens of thousands of dollars less in your pocket. Fidelity funds are known for keeping expenses extremely low, which is one reason they’re a top choice for long-term investors.
The tax cost ratio matters if you hold the fund in a taxable brokerage account. It measures how much of your return gets lost to taxes each year due to capital gains distributions. Actively managed funds often have higher tax costs because they trade more frequently. Index funds, especially total market funds, tend to be more tax efficient because they hold stocks for the long term and have lower turnover. The fidelity total market index fund, for instance, has a track record of low taxable distributions, making it ideal for taxable accounts.
When you compare funds, look at both ratios together. A low expense ratio doesn’t help much if tax costs are high. You can find these numbers in the fund’s prospectus or on financial websites. The key is to choose a fund that keeps both costs minimal.
To build a repeatable process for evaluating any investment, you can apply the same disciplined approach you’d use for analyzing individual stocks. Learning how to monitor a stock with the right metrics and tools gives you a framework you can adapt for fund analysis as well. The principle stays the same: focus on what actually moves your net returns and ignore the noise.
Expense Ratio Impact
FSKAX, the ticker for the fidelity total market index fund, carries an expense ratio of just 0.015%. You can confirm this low fee on the FSKAX fund quote on Morningstar.
Why does this number matter so much? Because even a 0.10% difference in fees can cost you thousands over time. Imagine you invest $50,000. In FSKAX, you pay $7.50 per year. In a fund with a 0.10% ratio, you pay $50. That $42.50 gap seems small at first. But over 30 years, assuming 7% annual returns, it grows to roughly $4,000 in lost wealth. And that is just on $50,000. On $500,000, the difference exceeds $40,000. All because of a fee gap that most investors overlook.
Every basis point (0.01%) you save stays in your account and compounds. That is the real power of choosing a fund with a negligible expense ratio like FSKAX.
To build a complete portfolio around this cost-saving principle, explore these stock advisor top 10 picks for big tech investors.
And to stay informed about the technology trends shaping markets, The AI Newsletter Worth Reading delivers clear daily AI updates straight to your inbox.
Tax Cost Ratio
Here is something many investors overlook: taxes. Even in a simple index fund, the tax cost ratio can quietly eat into your returns if you are not careful.
Luckily, funds like the fidelity total market index fund have naturally low turnover. That means the fund rarely buys and sells stocks. Less trading means fewer capital gains distributions. And fewer distributions mean less tax you owe each year.
For example, FSKAX has not distributed capital gains since 2020. That is a strong track record that makes it a smart choice for taxable accounts. You can read more in this FSKAX vs SWTSX tax efficiency comparison from experienced investors.
The tax cost ratio measures how much of your return is lost to taxes each year. It matters most in a regular brokerage account. Inside a tax-advantaged account like an IRA, it does not apply.
If you want to stay on top of market data that affects your portfolio, you can cut through the noise with futures news to monitor big picture trends. Combining smart fund choices with broader market awareness helps you keep more of what you earn.
Comparing Fidelity Total Market Index to Competitors
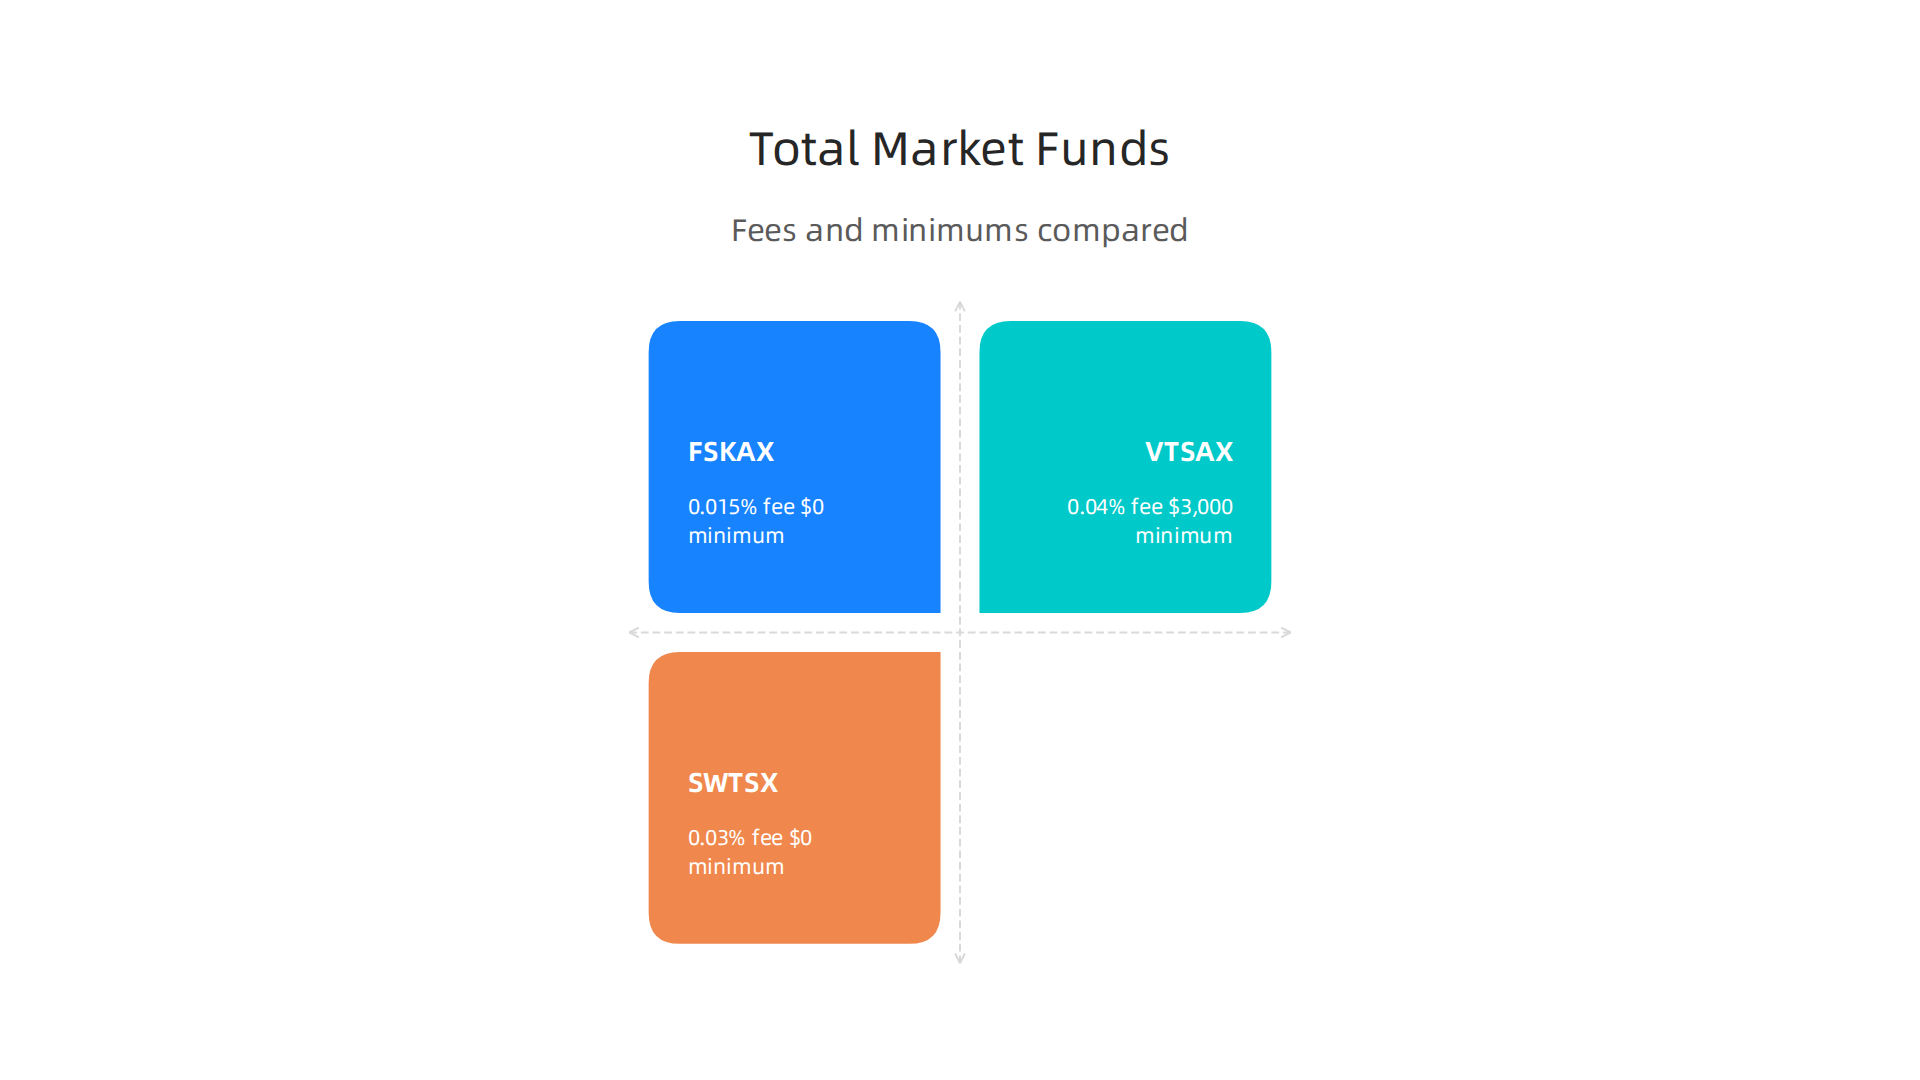
So how does the fidelity total market index stack up against the big names? Let’s look at VTSAX from Vanguard and SWTSX from Schwab.
These are the main competitors you will run into.
VTSAX is the most well known total stock market fund. It tracks the CRSP US Total Market Index. The expense ratio is 0.04%. That is very low, but there is a catch. You need at least $3,000 to start. That minimum can be a barrier if you are just getting started.
SWTSX from Schwab charges just 0.03% and has no minimum investment at all. It tracks the Dow Jones US Total Stock Market Index. The numbers are so close that picking between them is like splitting hairs. As the detailed comparison from Forbes points out, all three funds deliver nearly identical returns, exposures, and dividend yields.
The real differences come down to three things.
| Feature | Fidelity FSKAX | Vanguard VTSAX | Schwab SWTSX |
|---|---|---|---|
| Expense ratio | 0.015% | 0.04% | 0.03% |
| Minimum investment | $0 | $3,000 | $0 |
| Index tracked | Dow Jones US Total Stock Market | CRSP US Total Market | Dow Jones US Total Stock Market |
Notice something about FSKAX? It tracks the same index as SWTSX, but costs half as much. That tiny difference adds up over 20 or 30 years. The White Coat Investor analysis of FSKAX vs VTSAX confirms that both funds are nearly identical in makeup and performance. They track different indexes but the results are almost the same.
For tracking error, all three funds stay very close to their benchmarks. VTSAX sometimes misses its index by 1 or 2 basis points. FSKAX has actually outperformed its index in several periods by small amounts. These differences are too tiny to matter for most investors.
If you already have an account with one of these brokers, just buy their fund. If you are starting fresh, FSKAX gives you the lowest cost and no minimum. That is hard to beat.
Keeping up with market trends helps you make better fund decisions. You can get clear daily AI updates from The Deep View Newsletter to stay informed about the technology shaping the stock market.
Vanguard Total Stock Market Index
VTSAX is the Vanguard version of a total stock market fund. It has been around for over 25 years and is one of the most trusted index funds out there. Vanguard’s unique structure means the fund is owned by its investors, which helps keep expenses low.
Still, compared to the fidelity total market index funds, VTSAX has a slightly higher expense ratio of 0.04%. For a closer look, check out this SWTSX vs VTSAX comparison. The difference is just a few dollars per year, but over decades it adds up.
The other difference is the minimum. You need a $3,000 initial investment to get started. FSKAX from Fidelity has no minimum. So if you are short on cash, VTSAX might not be the best starting point.
On the plus side, VTSAX holds thousands of stocks and delivers returns that match the overall market. The tracking error is tiny. For investors who already have a Vanguard account, it is a solid choice.
To keep up with big picture market shifts, you can cut through the noise with futures news for big tech as part of your research.
Schwab Total Stock Market Index
If you have a Charles Schwab account, SWTSX is your go to total market fund. The expense ratio is just 0.03%, which is slightly lower than VTSAX. According to this SWTSX vs VTSAX comparison, both funds are incredibly cheap, but Schwab’s version saves you a few extra dollars per year.
The best part? There is no minimum investment. You can start with any amount. That makes it much easier for new investors to get in.
SWTSX tracks the Dow Jones U.S. Total Stock Market Index instead of the CRSP index that VTSAX follows. In practice, the returns are almost identical. Over long periods, the difference is tiny.
If you already bank with Schwab, SWTSX is a simple and low cost choice. The fund holds thousands of stocks and gives you exposure to the whole U.S. market.
To stay informed about the big picture, you can cut through the noise with futures news for big tech to track market trends. And if you want to keep up with the tech moves that drive these markets, The AI Newsletter Worth Reading delivers clear daily AI updates straight to your inbox.
Using the Fidelity Total Market Index in a Modern Portfolio
Building a portfolio starts with a strong foundation. The Fidelity Total Market Index fund is one of the best options for that job. It gives you exposure to thousands of U.S. companies at a very low cost. You get the whole market in one simple fund.
Make It Your Core
This fund can serve as your main equity holding. Most investors pair it with international stocks and bonds for full diversification.
Here is a simple breakdown:
| Asset | Percentage |
|---|---|
| U.S. Total Market (Fidelity) | 60% |
| International Stocks | 20% |
| Bonds | 20% |
This mix spreads your risk across different markets. You get growth from U.S. companies plus stability from bonds. The international portion adds protection if the U.S. market dips.
Rebalance Once a Year
Over time, some parts of your portfolio grow faster than others. Rebalancing keeps your target allocation in check. Once a year, sell a bit of your winners and buy the laggards. This forces you to buy low and sell high. It is a simple habit that keeps your risk level steady.
Watch the Market Without the Stress
A total market index removes the pressure of picking individual stocks. But you can still track market moves. Some investors check the spy stock price to see how the overall market is trending. Others look at specific sectors like finance to find opportunities. For example, keeping an eye on cincinnati financial stock can give you insight into regional banking trends.
For a deeper look at how to analyze major tech moves, check out this guide on top 10 stock picks for big tech investors. It gives you a repeatable way to spot trends and stay ahead.
With International and Bond Allocations
Now that you have the U.S. stock core, it is time to complete your portfolio. A classic three-fund portfolio uses three simple pieces: a total U.S. stock fund, an international stock fund, and a bond fund.
The Fidelity Total Market Index fund (ticker FSKAX) covers the U.S. side. You pair it with an international fund like the Fidelity Total International Index (FTIHX) and a bond fund like the Fidelity U.S. Bond Index (FXNAX).
How Much Goes Where?
Your split depends on your risk tolerance and how long you have to invest. A younger investor with 30 years until retirement can take more risk. They might choose 70% stocks (split 60% U.S. and 10% international) and 30% bonds. Someone closer to retirement might prefer 50% stocks (40% U.S. and 10% international) and 50% bonds for more stability.
International stocks have been strong lately. The Fidelity international stocks outlook for 2026 shows that non-U.S. shares have kept climbing and still trade at a discount compared to U.S. stocks. Adding international exposure lets you tap into growth in other countries and protects you if the U.S. market stumbles.
Bonds act as your portfolio’s cushion. They tend to move less than stocks and provide steady income. Even though the relationship between stocks and bonds has shifted in recent years, bonds still help reduce overall risk.
For a broader view of how global forces are shaking up markets, read this breakdown of how AI and geopolitical competition are reshaping the world market order. It helps connect the dots between world events and your investments.
Want to stay ahead of the trends that move markets every day? The AI Newsletter Worth Reading delivers clear daily updates on the biggest tech and AI shifts.
Rebalancing Strategies
Once you have your mix of U.S. stocks, international stocks, and bonds, you cannot just forget about it. Over time your portfolio will drift. For example, if your Fidelity Total Market Index fund (FSKAX) has a great year, it could grow to be a bigger slice of your portfolio than you planned. That means you are taking on more risk than you intended. Rebalancing fixes that.
Annual Rebalancing
Many investors rebalance once a year. Pick a date like your birthday or January 1. On that day, sell some of your winners and buy more of your laggards to get back to your target percentages. It is simple and easy to remember. Studies show that annual rebalancing works well for most people.
Threshold-Based Rebalancing
You can also rebalance when a fund drifts more than 5% from its target. This approach reduces how often you need to trade. It also helps you lock in gains from big movers and buy low when something falls. For example, if international stocks drop 10% below your target, you sell some bonds and buy more international. This method is more active but can reduce long-term drift.
Tax Implications
Be careful if you hold funds in a taxable account. Selling winners creates capital gains taxes. To avoid this, use new money to buy the underweight funds instead of selling. Or rebalance inside your retirement accounts where trades are tax-free. For more on how market volatility can affect your rebalancing decisions, check out this look at the big tech volatility index in 2026.
The bottom line: choose a rebalancing strategy that fits your style and tax situation, then stick with it.
Expert Perspectives on Total Market Indexing for 2026
Rebalancing your portfolio is important, but where should you put that money after you trim your winners or add to laggards? Financial experts have a clear answer for 2026. Low-cost total market index funds remain a core recommendation across the industry.

Why? Because these funds give you a piece of nearly every publicly traded company in the U.S. at a very low cost. You do not need to guess which stock will win. You own them all. The 2026 Global Investment Outlook from Franklin Templeton points to broadening opportunities across global capital markets, including U.S. smaller-cap stocks. That is exactly the kind of exposure a total market index provides.
Passive investing is still the favorite strategy of many advisors. By owning the whole market through a fund like the Fidelity Total Market Index, you capture the growth of big tech giants, financial firms, healthcare companies, and small emerging businesses all at once. You do not pay high fees for active managers who often struggle to beat the market over time.
For investors who are heavy on tech stocks, experts warn against concentrating too much in one sector. Even if AI and big tech have been driving returns, broad exposure helps you stay balanced when sector rotations happen. The Fidelity stock market outlook midyear 2026 notes that while technology is attractive, several other segments like energy and financials also offer potential. A total market fund automatically holds all of them.
If you are tempted to chase the latest hot stock tip on social media, remember that most individual stocks are volatile. A total market approach smooths out those bumps. You can also learn how to filter signal from noise in volatile stock discussions to stay focused on your long-term plan.
To keep up with how AI and big tech are shaping the market, you might want a quick daily briefing. Get clear daily AI updates from the AI newsletter worth reading and stay informed about the forces driving your total market returns.
Summary
This article is a practical, data‑driven look at the Fidelity Total Market Index fund (FSKAX) and whether it deserves a place in a 2026 portfolio. It explains what the fund tracks (the Dow Jones U.S. Total Stock Market Index), what you own when you buy it (thousands of U.S. stocks across sizes and sectors), and why low costs matter—FSKAX charges about 0.015% annually and has no minimum. The piece reviews historical returns and risk metrics, discusses tax efficiency and real‑world impacts of fees, and compares FSKAX to Vanguard and Schwab total market funds. It also shows how to use FSKAX as a core holding, how to pair it with international and bond allocations, and practical rebalancing approaches. By the end you’ll understand FSKAX’s strengths, how it stacks up against competitors, and clear steps to include it in a diversified, low‑cost portfolio.