
Introduction
You’re watching your watchlist and notice UAL stock is moving fast. Maybe it popped on strong earnings or dropped on fuel price worries. Either way, you need to understand what’s happening and decide what to do next.
The problem is, there’s too much noise. Every day you see headlines, tweets, analyst notes, and price charts. It’s easy to get stuck reading surface-level takes that don’t help you make better decisions. You end up feeling overwhelmed instead of informed.
That’s why a systematic approach matters. Instead of chasing every blip, you need a repeatable way to evaluate a stock like UAL, cut through the clutter, and focus on what really drives the story.

United Airlines has been putting up solid numbers. In 2025, the company posted a record $59.1 billion in revenue and grew adjusted EPS to $10.62. Early 2026 showed continued strength, with Q1 revenue up nearly 11% year over year. And with a P/E ratio around 9.7 and an EPS of $10.20, UAL offers a value angle compared to competitors like Delta. Tickeron and TIKR both highlight these metrics.

But this framework isn’t just for airline stocks. The same process works for DKNG stock, MCD stock, GS stock, or Wells Fargo stock. Any individual stock you track can benefit from a clear, structured review.
In this article, we’ll walk through a practical framework using UAL as our case study. You’ll learn how to monitor key data points, interpret what moves the stock, and avoid getting lost in information overload. By the end, you’ll have a simple system you can apply to any holding on your list.
And if you want sharper daily insights on the biggest moves in the market, The Deep View Newsletter delivers clear, research-backed analysis straight to your inbox.

It’s the kind of resource that helps you stay ahead without the noise.
For more context on tracking fast-moving names, check out our guide on the biggest movers today in big tech stocks. Now let’s build that framework.
Why Individual Stock Monitoring Demands a Structured Approach
Here’s the reality in 2026: you have more data at your fingertips than ever before. News feeds, analyst upgrades, earnings whispers, social media chatter, and real-time price charts. For a stock like UAL stock, a single tweet can send traders scrambling. But most of that information is noise. A structured approach helps you separate the signal from the static.
The sheer volume of tools and platforms available today shows how easily you can get lost. There are dozens of portfolio trackers, dashboards, and analysis tools competing for your attention. For example, the best stock market tracking software for 2026 includes everything from TradingView to Stock Rover, each promising to simplify your workflow. Yet without a clear framework, these tools just add more clutter.
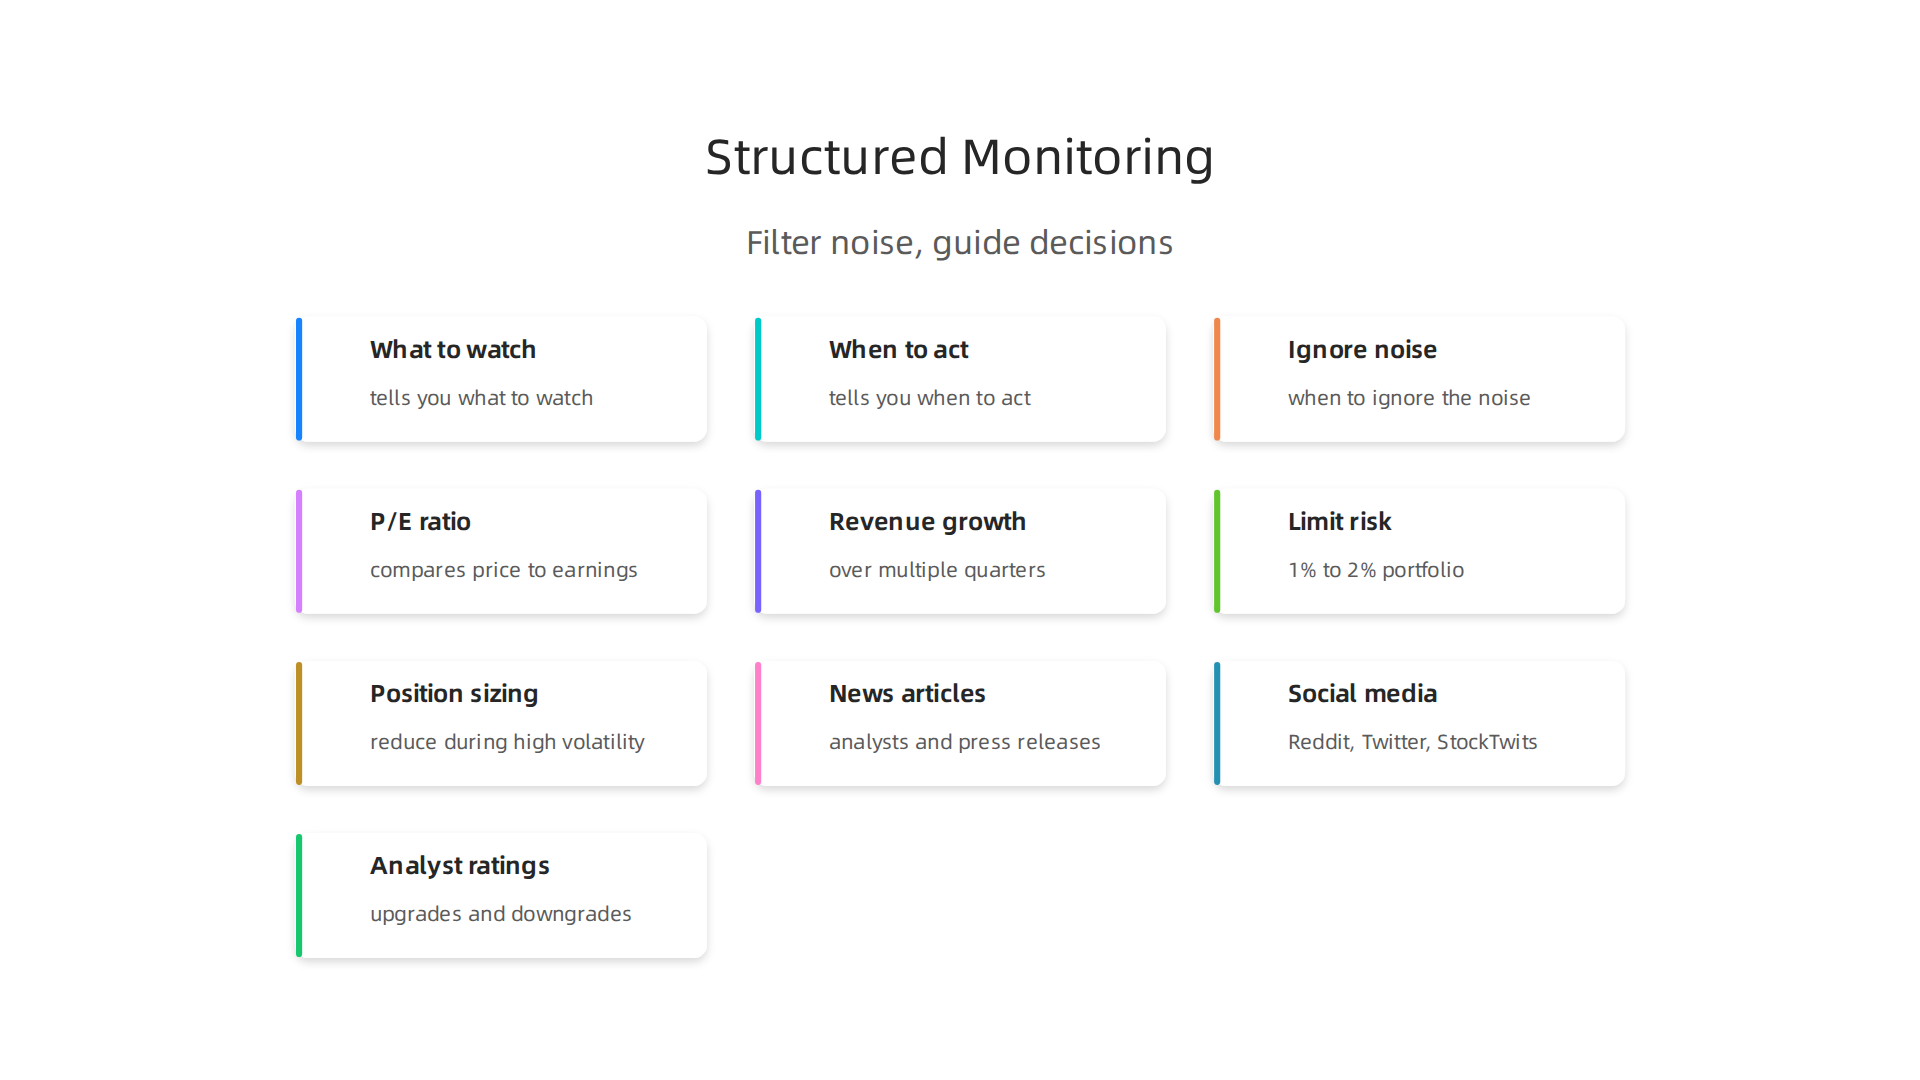
The risk of noise isn’t just frustration. It leads to bad decisions. When you react to every headline, you might buy high on fear of missing out or sell low on panic. A structured monitoring system acts as a filter. It tells you what to watch, when to act, and when to ignore the noise.
This matters most for high-stakes decision-makers. Whether you’re tracking DKNG stock, MCD stock, GS stock, or Wells Fargo stock, the same principle applies. You need a repeatable process that focuses on key metrics, catalysts, and risk levels. It’s not about predicting the future. It’s about being prepared for the moves that matter. For instance, knowing when to adjust position sizing during volatile periods can protect your portfolio. A trading risk management guide for 2026 recommends reducing position sizes when volatility spikes, a tactic that works across any stock you follow.
A structured approach also saves time. Instead of scanning dozens of sources, you know exactly which data points to check. That’s why many active traders rely on platforms that deliver daily P&L summaries directly to their inbox. It’s about efficiency, not just accuracy.
If you want sharper daily insights without the noise, The Deep View Newsletter delivers research-backed analysis straight to your inbox. It’s the kind of resource that helps you stay ahead.
For more on building a disciplined review process, check out our guide on stock advisor top picks for big tech investors in 2026. Now let’s look at the specific data points you should track for UAL stock.
UAL Stock: Company Profile and Recent Performance
Let’s zoom in on UAL stock. United Airlines is one of the biggest carriers in the United States, sitting alongside Delta, American, and Southwest. Its business model is built around a massive network of domestic and international routes, with major hubs in Chicago, Denver, Houston, and Newark. The airline also earns big from its MileagePlus loyalty program, cargo operations, and premium cabin services. That mix helps United weather seasonal ups and downs better than some smaller competitors.
So how has UAL stock performed recently? The numbers are impressive. United posted a record $59.1 billion in revenue for 2025, with adjusted earnings per share of $10.62. And the momentum kept going into 2026. In the first quarter of 2026, revenue jumped nearly 11% compared to the same period last year, according to a detailed Delta vs. United Airlines analysis that shows United is outpacing its main rival on several key metrics.
When you stack UAL stock against peer airlines, a few things stand out. As of mid-2026, United trades at a price-to-earnings ratio of 9.7, which is slightly cheaper than Delta’s 10.4. And its trailing twelve-month earnings per share of $10.20 blows past Delta’s $6.85, as shown in this DAL vs UAL comparison tool. That makes UAL an appealing value play, especially when the industry is focused on keeping capacity disciplined.
Looking at the broader big four, a Statista chart based on earnings confirms that Delta and United lead in revenue and net income. Southwest and American trail behind. Another comparison on American Airlines vs United Airlines highlights United’s stronger growth profile and lower risk compared to American.
Still, UAL stock faces real challenges. Fuel costs, labor negotiations, and debt levels from past fleet upgrades all matter. The airline industry is cyclical, and a sudden drop in travel demand could hit United hard. That’s why a structured monitoring approach is critical. You need to track earnings reports, capacity changes, and sentiment shifts without getting overwhelmed by daily noise.
For tools that help cut through the clutter and give you sharp market insights, consider adding The Deep View Newsletter to your daily reading list. It delivers research-backed analysis on big tech and market trends straight to your inbox.
And if you want to follow other stocks with the same discipline, our guide on biggest movers today in big tech stocks for 2026 can help you spot what’s driving price action across the sector.
Key Metrics for Monitoring Any Individual Stock
So you’ve got your eye on UAL stock. Maybe you’re also curious about DKNG stock, MCD stock, GS stock, or Wells Fargo stock. The real question is: how do you know which one is actually worth your money? The answer lies in a few key metrics that cut through the noise.
Let’s start with the basics. These are the numbers that tell you whether a stock is cheap, expensive, growing, or struggling. You don’t need to be a Wall Street analyst to use them.
Fundamental ratios that matter most
The price-to-earnings (P/E) ratio is the first stop for most investors. It compares the stock price to the company’s earnings per share. A lower P/E can mean the stock is undervalued. As we saw earlier, UAL trades at a P/E of 9.7, while Delta sits at 10.4, according to a side-by-side comparison of DAL and UAL. That makes UAL look like a value play.
But P/E alone isn’t enough. You also want to check the price-to-sales (P/S) ratio, especially for companies that aren’t yet profitable. The enterprise value-to-EBITDA (EV/EBITDA) gives you a clearer picture by including debt. Airline stocks carry a lot of debt from buying planes, so EV/EBITDA helps you see past that. A U.S. Department of Transportation financial review of major airlines shows how debt-to-equity ratios vary across the industry. You can use that same approach for any stock you research.
Growth metrics that show the trajectory
Past performance is nice, but future growth is where the money is. Look at revenue growth and earnings growth over multiple quarters. United posted record revenue of $59.1 billion in 2025 and saw Q1 2026 revenue jump nearly 11% year over year, as highlighted in a detailed Delta vs. United Airlines comparison. That kind of momentum matters.
Forward guidance is just as critical. Listen to what management says about future bookings, capacity plans, and cost pressures. A Statista chart on the four biggest U.S. airlines shows that Delta and United lead in revenue and net income. That leadership position often translates into stronger forward guidance.
Valuation context matters across industries
Here’s the thing: a P/E of 9.7 might be cheap for an airline, but expensive for a bank like Wells Fargo stock or GS stock. And MCD stock, a consumer staple, usually commands a higher multiple because of its stability. You can’t compare these numbers across industries. You have to compare a stock against its own sector.
An American Airlines vs United Airlines comparison shows United’s stronger growth profile and lower risk within its own peer group. That’s the kind of context you need.
You don’t have to track all these numbers manually every day. A good newsletter can do the heavy lifting for you. That’s why The Deep View Newsletter is worth adding to your morning routine. It delivers sharp analysis on key market trends and individual stock performance straight to your inbox.
And remember, looking at one stock in isolation is risky. You need to see the full picture of what’s moving the sector. Our guide on the biggest movers today in big tech stocks for 2026 can help you connect the dots between UAL stock and the broader market trends.
Technical Analysis Indicators for Timing Entry and Exit
So you know UAL stock is cheap based on the fundamentals. Great. But when do you actually buy it? That’s where technical analysis comes in.

Think of fundamentals as the "what" and technicals as the "when." You need both to make smart moves.
Moving averages show the trend
A moving average smooths out price data so you can see the direction more clearly. The most common ones are the 50-day and 200-day moving averages. Right now, UAL stock trades at $99.96, which is above its 50-day simple moving average of $93.43. That’s a buy signal according to a Financhill technical analysis of UAL. When the price stays above the moving average, the trend is up. When it drops below, watch out.
Moving averages also create support and resistance levels. If UAL pulls back to $93 and holds, that’s a potential entry point. If it breaks below, you might want to wait.
RSI tells you if it’s overheated
The Relative Strength Index (RSI) measures whether a stock is overbought or oversold. It runs from 0 to 100. Above 70 means overbought, and a pullback might come soon. Below 30 means oversold, and a bounce could be near.
Check out what happened with American Airlines stock recently. The AltIndex technical analysis of AAL showed an RSI of 72, which signaled overbought conditions. That’s a warning to wait or take profits. You can apply the same logic to UAL stock or any other name like DKNG stock, MCD stock, or GS stock.
MACD catches momentum shifts
The Moving Average Convergence Divergence (MACD) shows when momentum is changing. It compares two moving averages and signals buy or sell when they cross.
The data can get confusing because different timeframes give different signals. One source shows UAL MACD at 4.30 suggesting a Sell, while another shows it at 4.296 suggesting a Strong Buy. The trick is to look at the direction of the MACD line, not just the number. If it’s moving up, momentum is building. If it’s falling, the trend is weakening.
Volume and breakouts confirm the move
Volume tells you if a price move is real or fake. A breakout on low volume is suspect. A breakout on heavy volume is more likely to hold. For airline stocks, watch for breakouts above resistance levels on rising volume. That’s often the signal to enter.
One limit of technical analysis: it can give false signals, especially in volatile sectors like airlines. You should always combine it with fundamentals. A stock can look technically perfect but be a bad investment if the company is losing money. That’s why understanding the broader market context matters. A TradingView technical summary of UAL aggregates multiple indicators into one gauge, which helps cut through the noise.

And if you want to get deeper into how volatility affects these signals, check out our guide on how the VIX stock became a big tech volatility index in 2026. It connects the dots between fear, greed, and your entry timing.
Sentiment Analysis: Gauging Market Mood Around UAL Stock
You’ve looked at the charts. You know the moving averages and RSI. But here’s the thing: markets are driven by people. And people have moods. Sentiment analysis helps you measure the crowd’s emotions around a stock like ual stock. When you combine it with technical analysis, you get a much clearer picture.
Where sentiment comes from
Sentiment flows from four main sources:
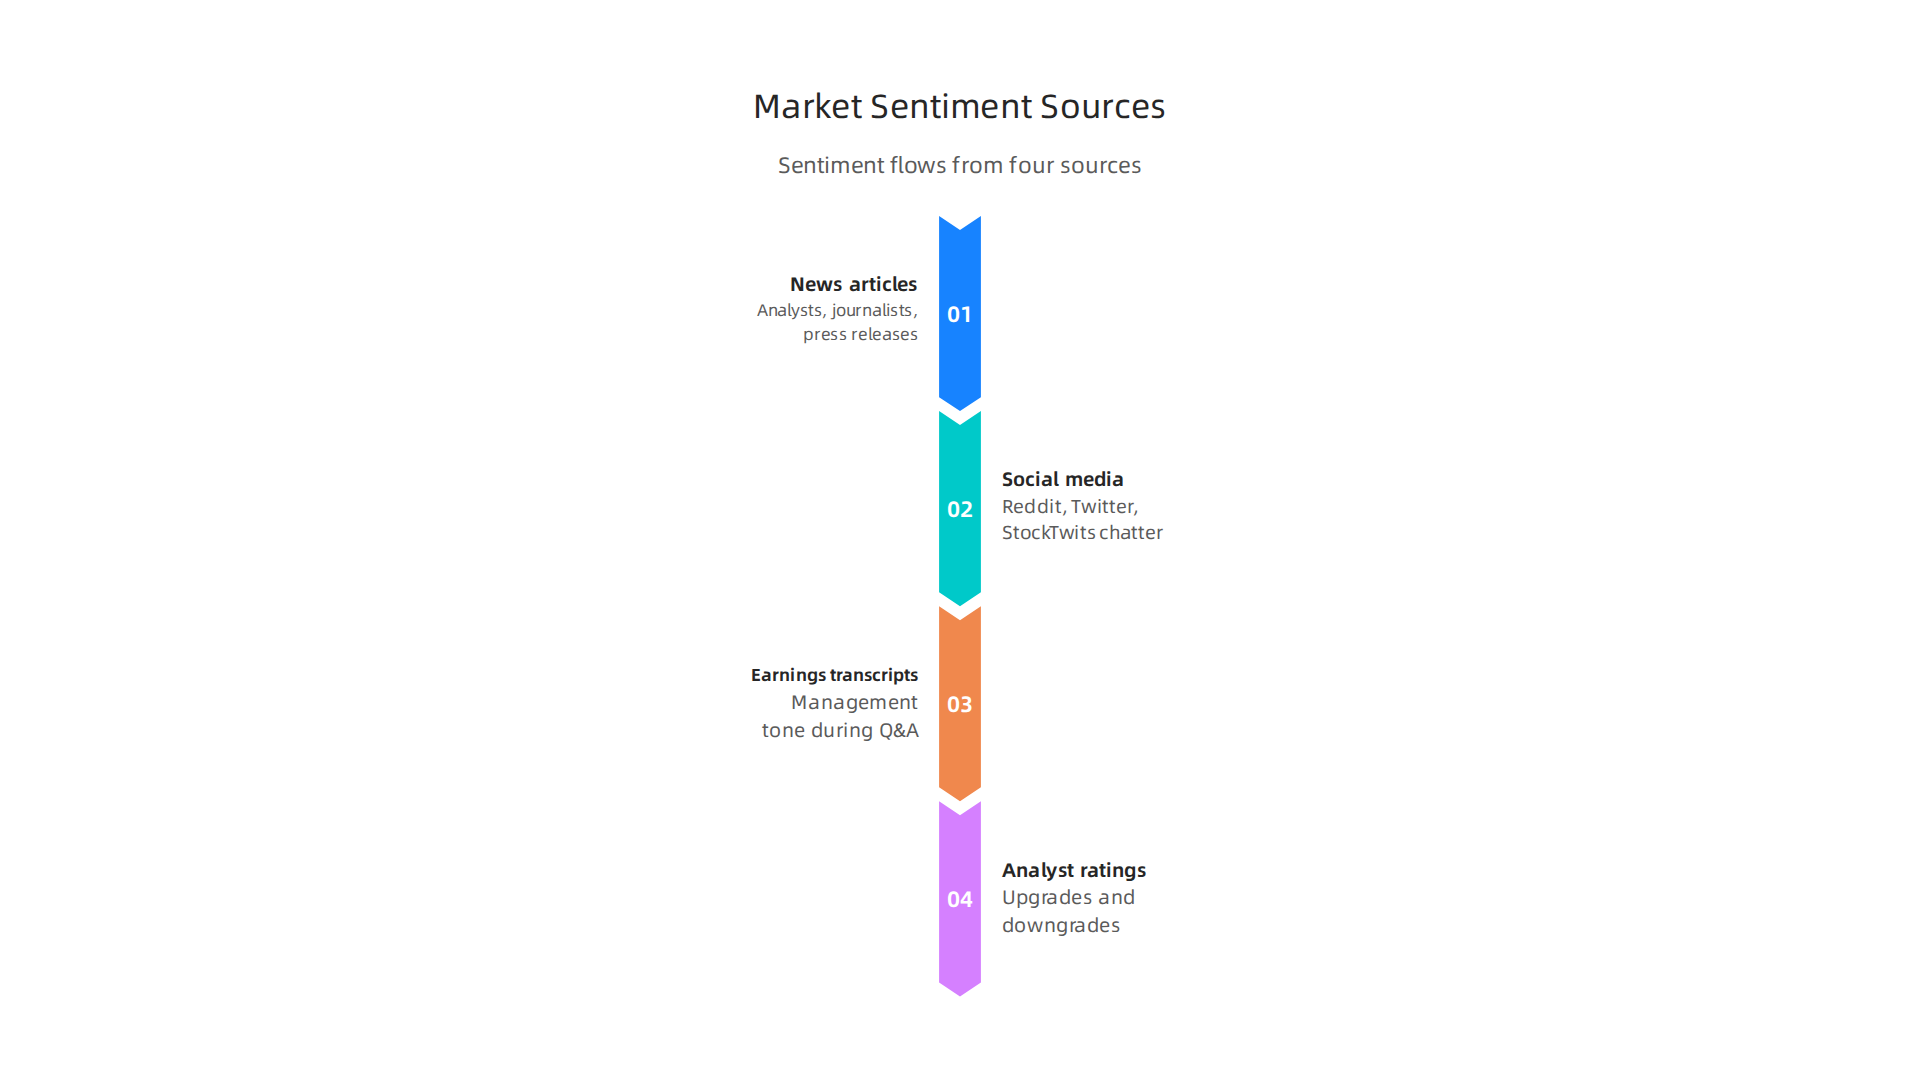
- News articles – Analysts, journalists, and press releases shape the narrative.
- Social media – Platforms like Reddit, Twitter, and StockTwits buzz with retail chatter.
- Earnings call transcripts – The tone of management during Q&A reveals hidden confidence or worry.
- Analyst ratings – Upgrades and downgrades move prices fast.
Research shows that social media sentiment can actually predict daily stock returns. One study found a high correlation between stock price and sentiment, with a coefficient of 0.72. That’s a strong link. Another paper from AUT University found that higher social media sentiment leads to higher return autocorrelation the next day. What does that mean for you? When the crowd gets excited, the trend often keeps going.
Tools that score sentiment automatically
You don’t have to read every tweet yourself. Automated tools scan thousands of posts and articles, then spit out a score. Some platforms track sentiment for ual stock alongside names like dkng stock, mcd stock, gs stock, and wells fargo stock. They rate sentiment as bullish, bearish, or neutral. The trick is to watch for big shifts. If sentiment suddenly jumps from neutral to highly positive, the stock may be getting frothy. If it drops sharply, a contrarian buy could be setting up.
A real example: sentiment before UAL earnings
Think back to United Airlines’ last earnings surprise. In the weeks before the report, social media sentiment started climbing. Positive news about travel demand and cost cuts spread fast. The crowd got optimistic. Then earnings came in strong and the stock popped. If you had been watching sentiment indicators, you would have seen the shift early and positioned yourself ahead of the move.
Sentiment analysis isn’t perfect. Sometimes the crowd is wrong. But when you layer it on top of your technical signals, you reduce the noise. It’s like having a second opinion.
Want to stay ahead of the market mood every day? The Deep View Newsletter delivers clear AI-driven insights straight to your inbox. It helps you cut through the hype and spot the real signals. Sign up for The Deep View here. And if you want to see how retail traders on Reddit move stocks, check out our guide on WallStreetBets and retail sentiment in 2026.
Macroeconomic and Industry Factors Affecting UAL and Similar Stocks
Sentiment tells you what the crowd feels. But macro forces tell you what the business actually faces. If you ignore fuel prices, interest rates, and travel demand, you are missing the bigger picture around ual stock.

The big macro drivers
Jet fuel is the single biggest cost for any airline. When oil prices spike, profits get squeezed fast. In 2026, airlines are hiking fares and cutting capacity to cope with a sudden surge in oil prices. Higher fuel costs are putting real pressure on profitability across the sector, as Air Cargo Week reports. That directly hits the bottom line for ual stock and every other carrier.
Consumer spending is just as important. People fly more when they feel good about their wallets. Air travel demand grew 6% in 2025, and BCG expects 5.8% growth in 2026. The IATA forecasts 4.9% year-over-year growth in passenger traffic. That is a strong tailwind for airlines. The question is whether higher costs cancel out those gains.
Interest rates also matter. Higher rates make borrowing more expensive. Airlines need debt to buy planes and upgrade fleets. When rates rise, growth slows and stock prices can feel the weight.
Industry factors you cannot ignore
Every airline faces its own set of challenges. FAA regulations can ground planes or delay new routes. Labor costs keep climbing as unions negotiate new contracts. Fleet modernization requires billions in capital. And competition stays fierce. United fights Delta, American, Southwest, and budget carriers every day. Each fare war shaves margins a little more.
The same logic applies to other sectors. dkng stock moves with sports betting laws and user growth. mcd stock tracks consumer spending and commodity costs. gs stock rises and falls with deal-making activity and interest rates. wells fargo stock reacts to rate changes and loan demand. Every stock tells a different story about the economy.
How to track these factors simply
You do not need to watch everything. Just focus on three things:
- Fuel prices – Check crude oil and jet fuel prices once a week
- Consumer health – Watch monthly jobs reports and retail spending data
- Regulatory news – Follow FAA decisions and union contract updates
When you layer this context on top of your sentiment and technical signals, you understand whether a move in ual stock comes from company news or bigger economic winds. That makes you a smarter, more confident investor.
Want a daily shortcut to understanding what actually moves markets? The Deep View Newsletter cuts through the noise with clear AI-driven insights every day. And if you want a broader investing roadmap, check out our stock advisor top 10 picks for big tech investors in 2026.
Building a Custom Monitoring Dashboard for UAL and Your Watchlist
You have the macro picture now. Fuel prices, travel demand, interest rates. But without a dashboard, all that information just becomes noise. A good dashboard pulls together the data that actually matters for ual stock and any other stocks you follow. It lets you see price moves, volume changes, breaking news, and key fundamentals all in one place.
What to track
Keep it simple. Focus on four things:
- Price and volume – Watch the current price, daily change, and trading volume. Sudden volume spikes often signal big news.
- News and sentiment – Use a news feed that filters for relevant stories. Avoid generic headlines.
- Fundamentals – Track key numbers like earnings per share, revenue growth, and debt levels.
- Fuel cost indicator – Since fuel is United’s biggest expense, add a crude oil price widget. That directly affects ual stock.
Tools to build your dashboard
You do not need a Bloomberg terminal to get started. Free and low cost options work great. Google Finance gives you a basic watchlist with price and news. For more power, try TradingView or Koyfin. Koyfin offers customizable dashboards that cover multiple asset classes, according to AlphaSense. And if you want daily profit and loss summaries, platforms like TradeAlgo deliver those via email or push notifications.
You can also track dkng stock, mcd stock, gs stock, and wells fargo stock on the same dashboard. Just add them to your watchlist.
Set alerts that filter noise
This is the most important step. Do not set alerts for every tiny move. Instead, set alerts for:
- Price breaking above or below a support or resistance level
- Volume exceeding the average by 50% or more
- Major news events like earnings reports or FAA announcements
- Oil price jumps of more than 5% in a day
That way you only get notified when something actually matters. You avoid the distraction of random price blips.
Want to see how all these signals play out together for big tech names? Read our breakdown of the biggest movers today in big tech stocks for 2026.
And if you want a daily summary that connects the dots for you without building your own dashboard, the Deep View Newsletter delivers clear AI driven insights straight to your inbox every day.
Risk Management and Position Sizing for Individual Stocks
Even the best dashboard is useless if you ignore risk management. Without it, one bad move can wipe out weeks of good calls.

That is especially true for ual stock, which moves sharply on fuel price spikes and air travel demand shifts.
Here is the core principle. Never risk more than 1% to 2% of your total portfolio on a single trade.
That is a standard rule in risk management for 2026. If you have a $50,000 account, your maximum loss per trade should be $500 to $1,000. This simple rule protects you from big drawdowns when volatility hits.
Position sizing for UAL
United is a cyclical stock. Air travel demand is still growing at 4.9% according to IATA, but fuel costs remain a wild card. Higher jet fuel prices in 2026 are pressuring profitability across the industry. That means ual stock can swing hard on oil news. During high volatility, you should reduce position sizes and widen stop losses.
A practical approach. If you normally buy 100 shares of mcd stock or gs stock, start with only 50 shares of ual stock. Leave room to add more if the price drops to a better entry. Same logic applies to dkng stock and wells fargo stock. Different sectors, different risk profiles.
Diversification protects you
Do not put all your eggs in the airline basket. Spread your watchlist across sectors. Pair ual stock with defensive names like mcd stock or financials like gs stock. That way a fuel crisis hurts only part of your portfolio.
The emotional trap
The hardest part is psychological. When ual stock drops 5% in a day, your gut says sell everything. That is exactly when you should stick to your plan. Overtrading and chasing losses are the fastest ways to blow up an account. Learn more about this in our breakdown of how WallStreetBets moves markets.
Want to make smarter trades without the emotional noise? The Deep View Newsletter delivers clear daily insights on AI and tech trends that help you stay disciplined and informed.
Summary
This article gives a practical, repeatable framework for monitoring a single stock using United Airlines (UAL) as a case study. It shows which fundamental ratios (P/E, EV/EBITDA, revenue and earnings growth) matter, how to use technical signals (moving averages, RSI, MACD, volume) to time trades, and why sentiment and macro factors (fuel, consumer demand, rates) must be layered on top. You’ll learn how to build a simple dashboard, set high-signal alerts, and size positions to limit downside during volatile periods. The piece explains the tools and rules of thumb that cut through daily noise and shows how to apply the same process to any stock on your watchlist. By following the steps here you’ll be able to spot the drivers behind big moves, decide when to act, and protect your portfolio from emotional overreactions.